
XRP Price Prediction – February 16
Ripple technical levels flash negative signals following rejection at $0.33. The Rising wedge pattern suggests that a dive to $0.26 is possible in the near term.
XRP/USD Market
Key Levels:
Resistance levels: $0.35, $0.36, $0.37
Support levels: $0.23, $0.22, $0.21

The price of Ripple (XRP) is slowly declining below the key supports as the price may revisit the $0.26 support before it could start a fresh increase for the new week. However, after struggling to stay above $0.33 where it was rejected today, XRP/USD started a slow and steady decline. The coin traded below the key $0.26 support level to move into a short term bearish zone before pulling back to $0.28 level.
Moreover, the pair is currently changing hands at $0.28 and as the coin is already trading below the 9-day moving average, any attempt to make it close below the 21-day moving average, it may open the door for more downsides and the price could spike below the $0.26 support level. In other words, for an upsurge, traders should keep an eye on the $0.30 and $0.32 before creating a new bullish trend at the resistance levels of $0.35, $0.36 and $0.37.
Furthermore, we may experience a quick buy once the trade reaches the support at $0.31. And should in case the price fails to rebound, then a bearish breakout is likely to trigger more selling opportunity for traders, which might cause the price to retest $0.25 and could further drop to $0.23, $0.22 and $0.21 support levels respectively. Meanwhile, the RSI (14) nosedives below 60-level, if the price continues to move downward, XRP may definitely fall more.
Against Bitcoin, the situation is becoming bleak as the price moves below the 9-day moving average at 2902 SAT. The XRP/BTC was unable to break above the 3104 SAT resistance level, causing a drop down to 2784 SAT even as at yesterday. The market opens today with an uptrend, after touching 3174 SAT, the coin started dropping at the time of writing.
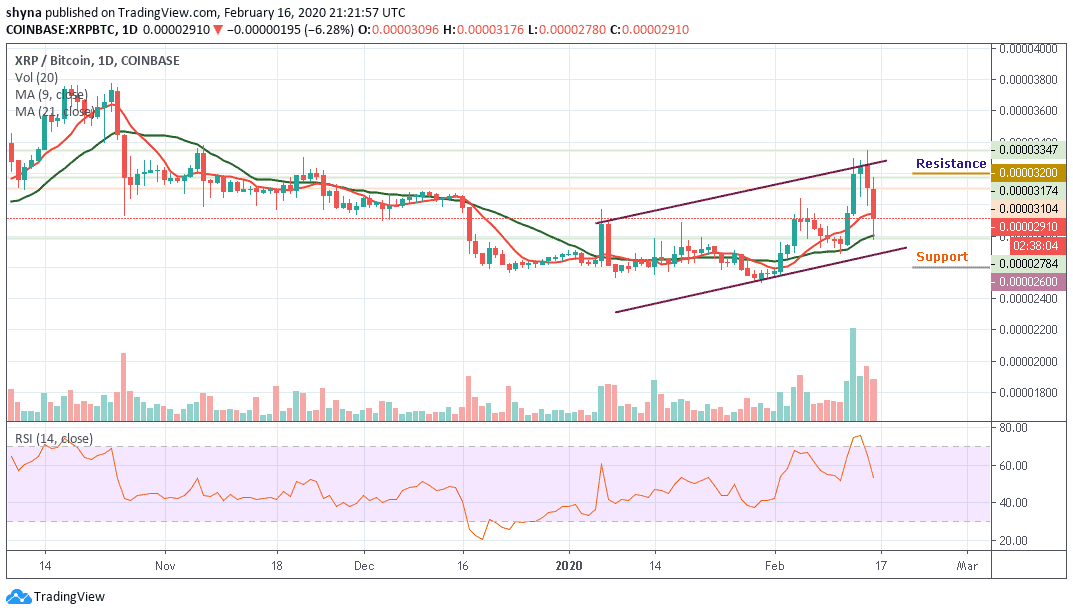
Furthermore, from the upside, the nearest level of resistance lies at 3150 SAT, if the bulls can break above this level, further resistance may be found at 3200 SAT and 3300 SAT but if the sellers continue to push the price beneath the current 2910 SAT, the next level of support is located at 2700 SAT and more support is found at 2600 SAT and 2500 SAT. The RSI (14) has crossed below 60-level as the bears gain control of the market.
Please note: Insidebitcoins.com is not a financial advisor. Do your research before investing your funds in any financial asset or presented product or event. We are not responsible for your investing results.
