
Bitcoin (BTC) Price Prediction – June 29
The Bitcoin bulls’ side is seen above the bears at numerous levels in the move towards the resistance level of $9,300.
BTC/USD Long-term Trend: Ranging (Daily Chart)
Key levels:
Resistance Levels: $9,800, $10,000, $10,200
Support Levels: $8,600, $8,400, $8,400

BTC/USD hit pause within a whisker of $9,200 and this incredible breakout occurred following the consolidation period over the weekend. More so, the yesterday’s recovery was not only unique to Bitcoin, other cryptocurrencies generally corrected higher across the board. Today, the largest digital assets extended the gains above $9,200 and even approached $9,230. Meanwhile, a high formed at $9,240 may put a stop to the bullish momentum.
However, the daily chart reveals that BTC/USD is trading above the crucial levels that will now function as the support zones in the event a reversal occurs. Meanwhile, on the upside, as the coin moves toward both the 9-day and 21-day moving averages, little is in place to prevent correction targeting the key resistance of $9,500 as the technical indicator RSI (14) moves above 45-level.
However, the Bitcoin pair is strongly supported at the various former resistance levels include $8,998, $8,928, and $8,807. Nevertheless, the bulls are also banking on the support at $8,600, $8,400, and $8,200 to ensure that in spite of a reversal, the Bitcoin price stays above $9,000 level. Nonetheless, any bullish movement above the moving averages may reach the resistance levels of $9,800, $10,000, and $10,200 respectively.
BTC/USD Medium – Term Trend: Bearish (4H Chart)
According to the 4-hour chart, with the sudden move of Bitcoin price above $9,200, Bitcoin’s chances of violating the old support of $9,225 now became resistance. The bulls are not out of the wood yet but a break above $9,500 is needed to invalidate the bearish case as RSI (14) focuses at the north as the signal line is about to cross above the 60-level.
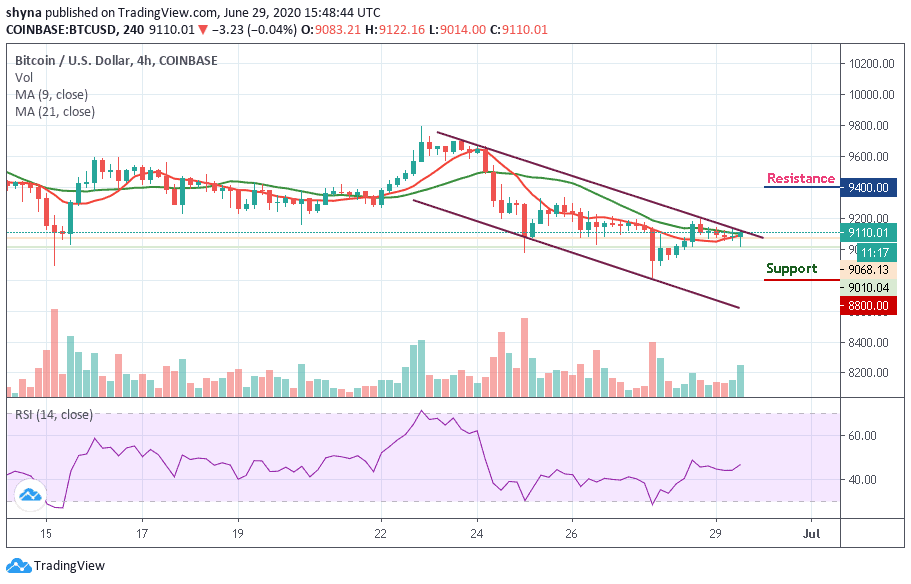
However, a high-volume break above $9,300 could violate the bearish pattern of the highs and shift the risk to a rise of $9,400 and above. In particular, the movement above $9,000 is supported by an increase in buying volumes. As a result, prices could reach $9,500 in the next few hours to end this month as the market is been supported by a $9,000 level and below.
