
Data from Glassnode shows that Bitcoin’s latest rejection around the $23,800 level coincided with the cost basis of a particular whale group.
Whales Who Bought Following December 2018 Have Their Cost Basis At $23,800
According to the latest weekly report from Glassnode, all three whale groups being considered here went underwater for a while after the FTX crash took place last year.
The relevant indicator here is the “realized price,” which is a price derived from the realized cap. This capitalization model for Bitcoin assumes that the actual value of each coin in the circulating supply is not the current BTC price (as the market cap says), but the price at which it was last moved.
When this cap is divided by the total number of coins in circulation, the realized price is obtained. The significance of this metric is that it represents the average acquisition price in the BTC market.
This means that when the normal price of Bitcoin sinks below this realized price, the average holder goes into a state of loss. This realized price is the average cost basis of the entire market, but the indicator can also be defined for specific portions of the market.
An important cohort for any cryptocurrency is the “whale” group, which, in the case of BTC, includes all investors that are holding at least 1,000 coins in their wallets. As this group is large and diverse, Glassnode has divided it into three subgroups to study the most favorable realized prices across different eras.
The analytics firm has divided these groups by using different acquisition start points for each. For the first group, the cutoff is July 2017, which was the launch of the cryptocurrency exchange Binance.
For the second, it’s December 2018 (the bear market lows of the previous cycle), and for the last one, it’s the COVID bottom in March 2020. Also, in order to find at what exact prices these whales have been buying their coins, Glassnode has only considered exchange transactions here (as this cohort usually uses these platforms for buying and selling).
Here is a chart that shows how the cost bases of these Bitcoin whale subgroups have changed over the years:
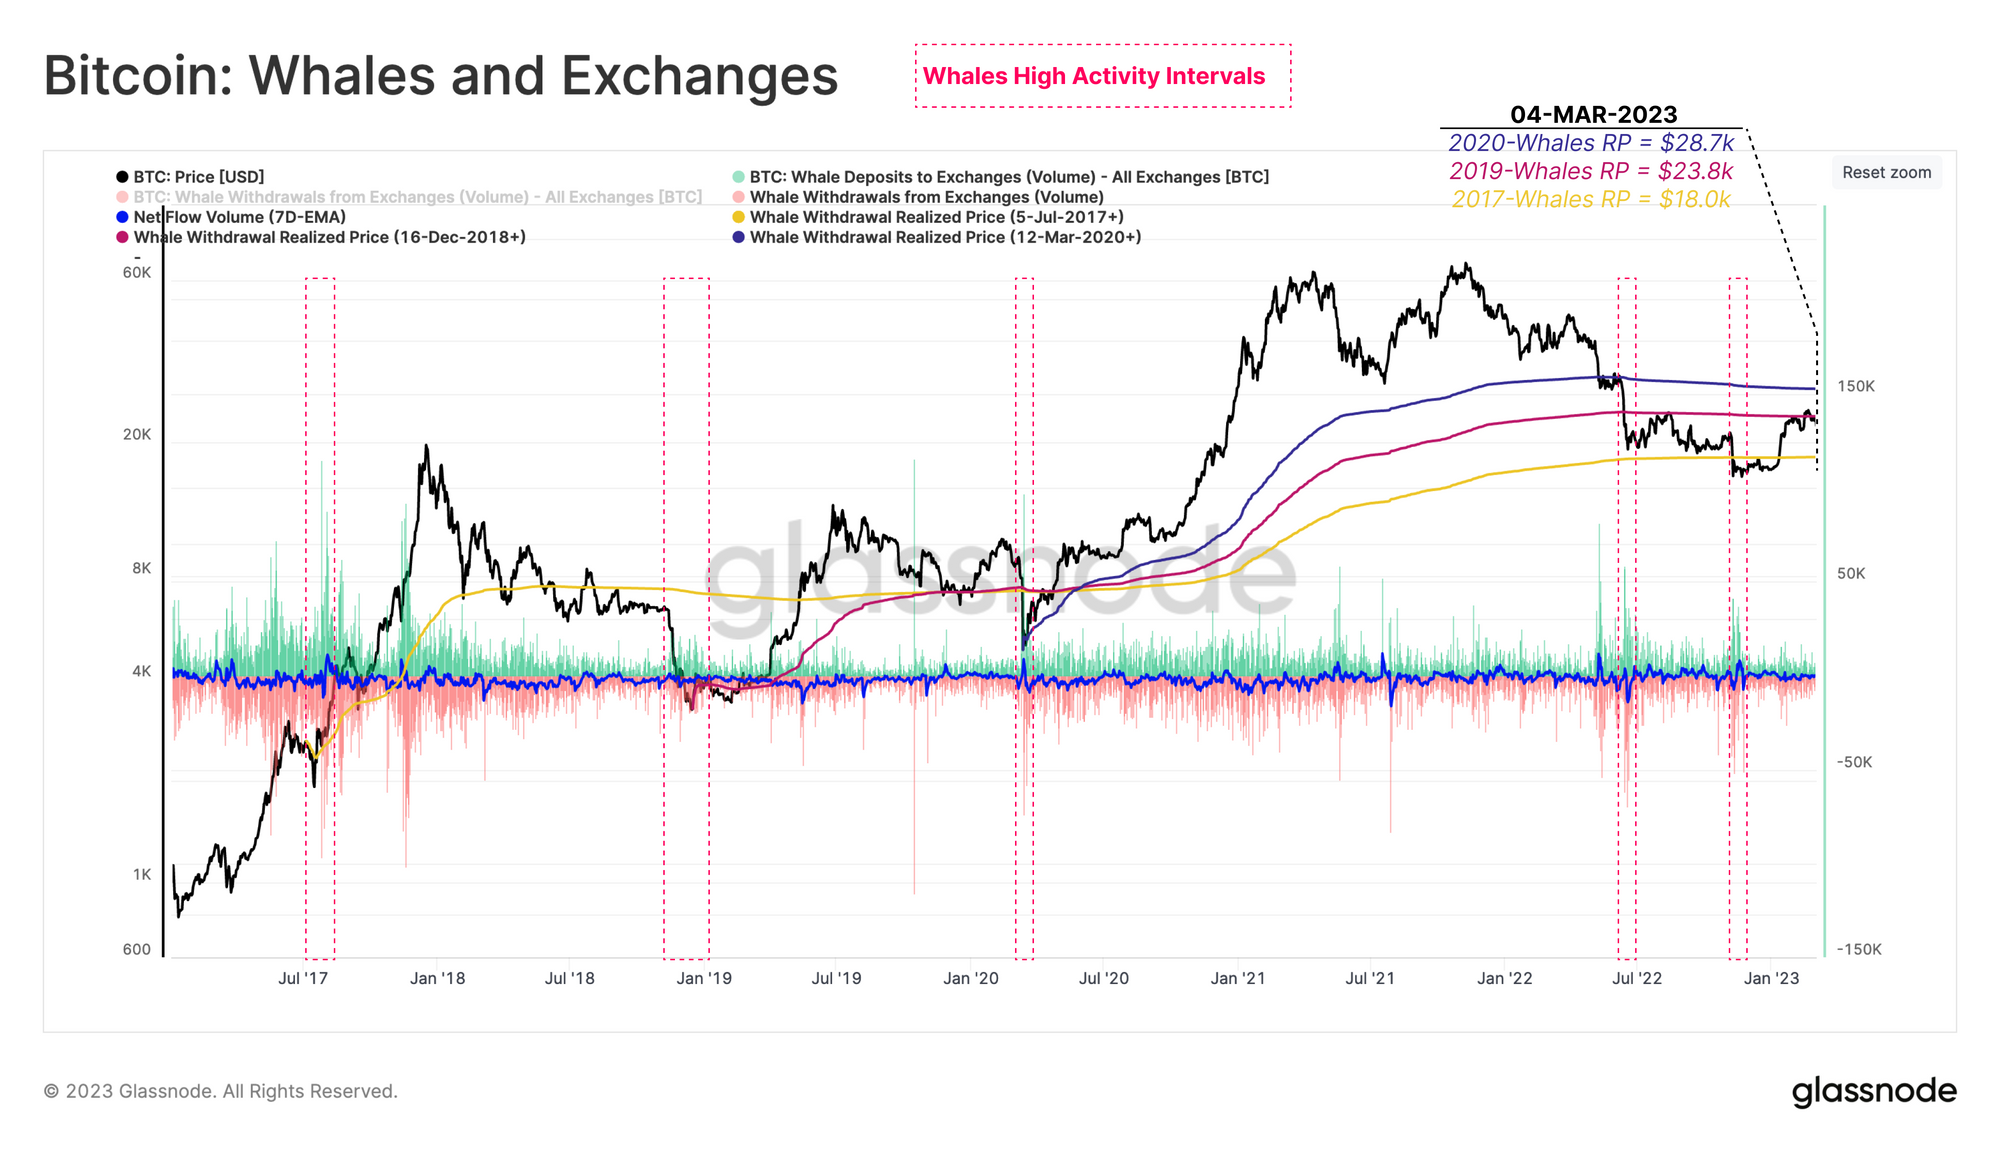
The realized prices of the different whale subgroups in the market | Source: Glassnode's The Week Onchain - Week 10, 2023As displayed in the above graph, the 2017+ era whales have their realized price at around $18,000 right now, suggesting that the average whale that has acquired their coins between today and 2017 is in a state of profit right now.
The 2018+ and 2020+ whales, however, seem to be in losses currently as their realized prices are $23,800 and $28,700, respectively. Interestingly, the resistance that Bitcoin has been facing recently is approximately the same level as the cost basis of the former group of whales.
This is clearly visible in the chart, where the latest rally can be seen to have come to a halt as the cryptocurrency’s price has encountered this level. In the past, cost basis levels like these have usually offered resistance to the price because of the fact that investors, who had previously been in loss, see such levels as ideal selling windows.
At the time of writing, Bitcoin is trading around $22,400, down 4% in the last week.
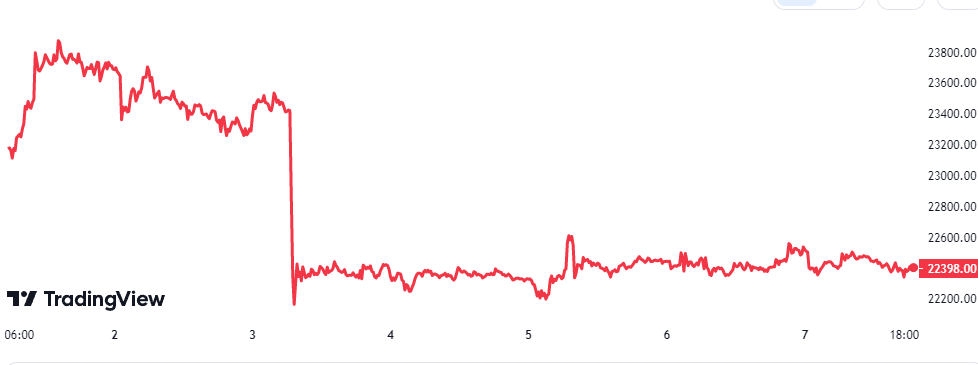
Looks like BTC is still moving flat | Source: BTCUSD on TradingView