
Data from this on-chain metric is currently forming a pattern that can suggest the “buy the dip” mentality is returning to the Bitcoin market.
Bitcoin aSOPR (7-Day EMA) Bounced Off The 1 Line Recently
As per the latest weekly report from Glassnode, the aSOPR has retested the 1 line recently. The “Adjusted Spent Output Profit Ratio” (aSOPR) is an indicator that measures the ratio between the profits and losses that are being realized in the Bitcoin market right now.
The metric has “adjusted” in the name because it filters out all sales of tokens that took place only one hour after the last one. Making this adjustment helps remove noise from the data that wouldn’t have had any long-term consequences on the market.
When the value of the indicator is greater than 1, it means the average investor is selling coins at a profit currently. On the other hand, values below the threshold suggest the overall market is realizing losses at the moment.
Naturally, the aSOPR having a value exactly equal to 1 implies the holders are just breaking even on their selling right now as the profits being realized are exactly making up for the losses.
Now, here is a chart that shows the trend in the 7-day exponential moving average (EMA) Bitcoin aSOPR over the past year:
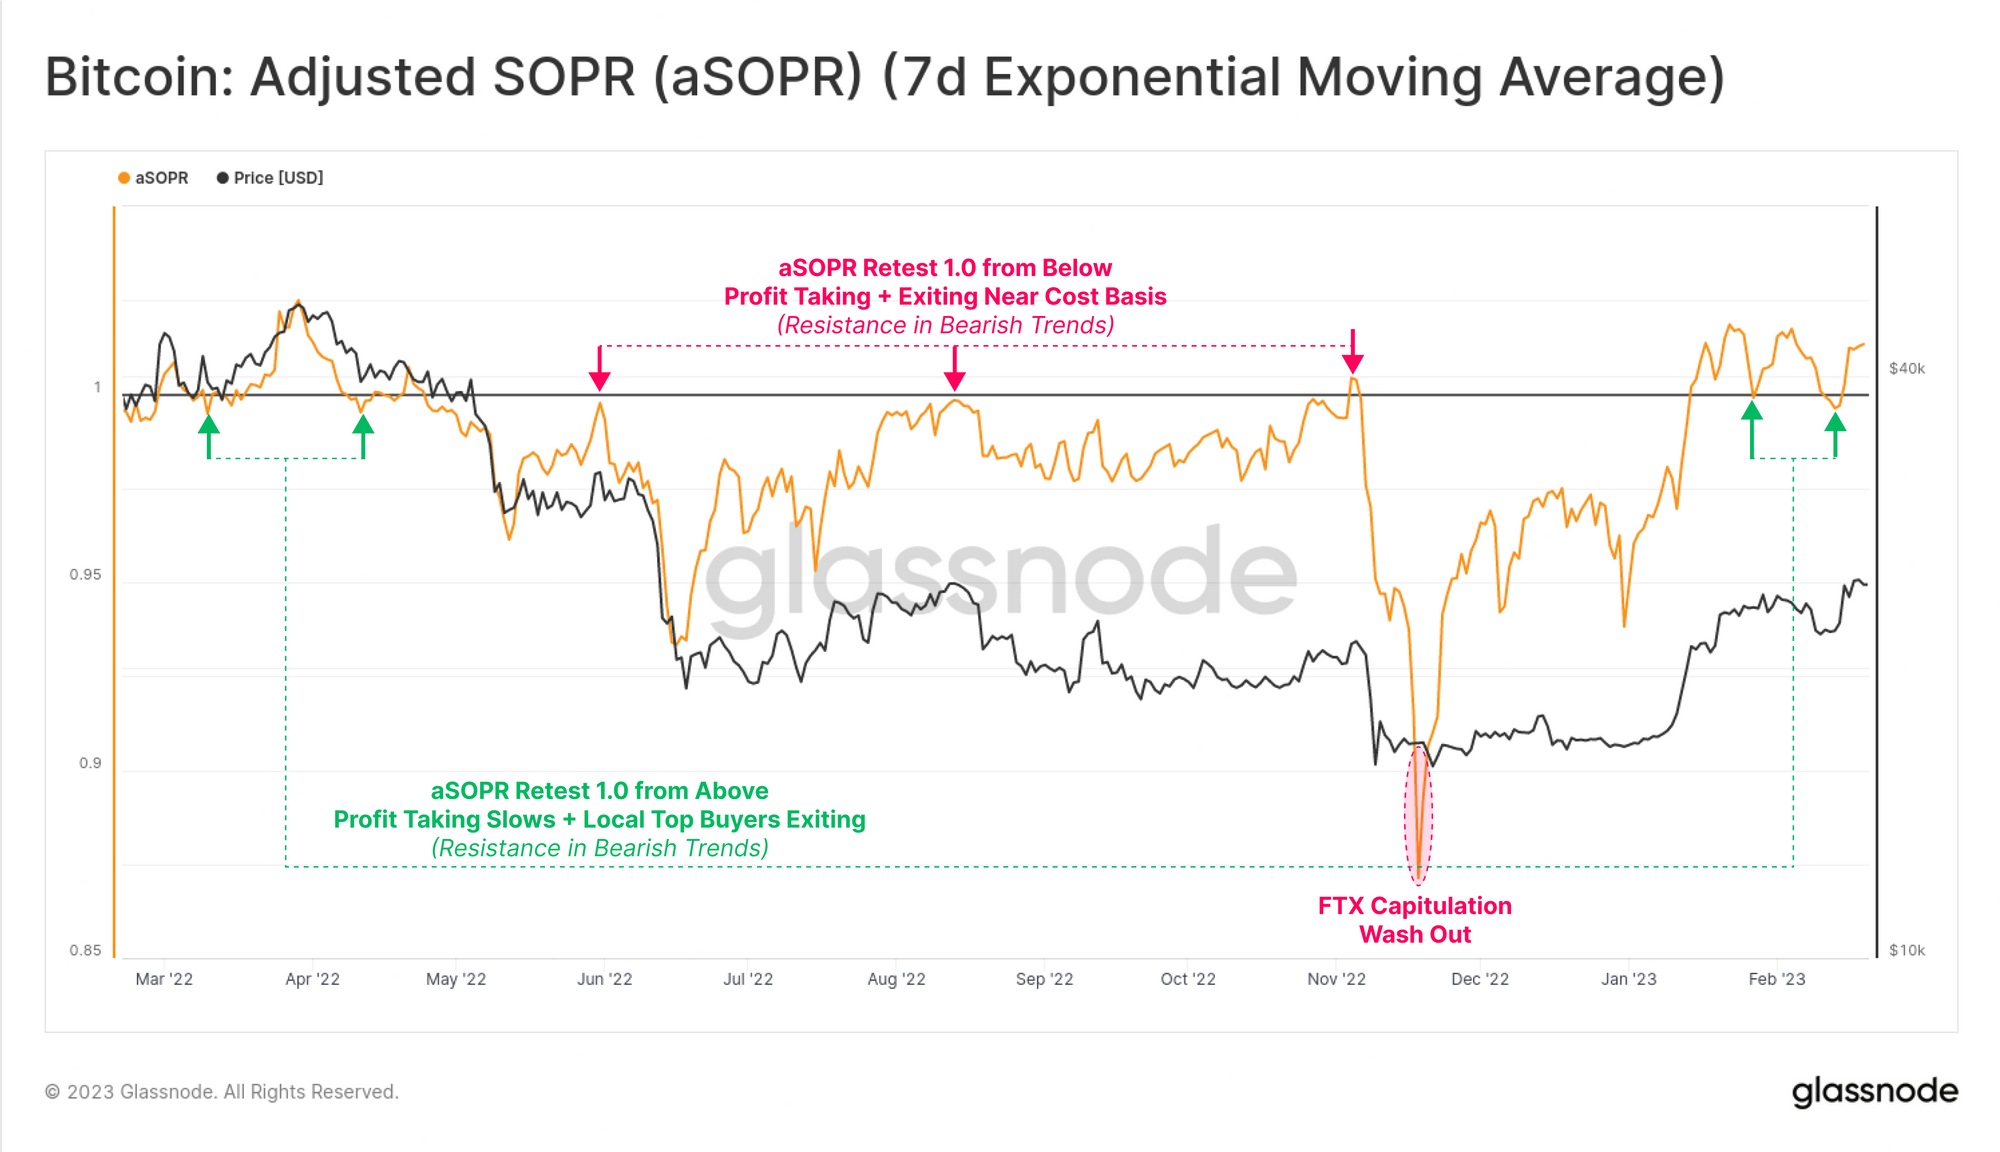
Looks like the 7-day EMA value of the metric has gone up in recent days | Source: Glassnode's The Week Onchain - Week 8, 2023As shown in the above graph, the 7-day EMA Bitcoin aSOPR had been under the 1 level during the bear market, but with the latest rally, the metric has successfully broken above the mark.
This means that during the bear market lows, the investors had been selling at losses, but thanks to the latest price surge, they have entered into enough gains to be able to move coins at a profit.
This makes sense, but the indicator holds even more interesting information that can be seen by its interactions with the line at which its value becomes 1. From the graph, it’s apparent that during the recent bearish period, the indicator was constantly finding rejection whenever it reached this mark.
The reason behind this is that investors see this break-even level as getting the money “back” that they had previously lost due to bear market price plunges. Because of this, a lot of selling occurs here, thus leading to the price (and the metric itself) facing resistance.
In bullish periods, however, this trend reverses and the line becomes a support level for Bitcoin instead. This psychological shift happens because in bull rallies investors start seeing their break-even mark as a buying opportunity instead and thus a lot of buying takes place here, providing a boost to the price.
With the latest rally, this shift seems to have already started to take place, as the 7-day EMA aSOPR has found support at this line during the last two retests, as is visible in the chart.
“Overall, this signals a reduction in sell-side pressure and a potential return of the ‘buy-the-dip’ mentality,” notes Glassnode. “A convincing SOPR retest and bounce from 1.0, especially on longer-term moving averages (14D or 30D, for example), is often a signal of a shifting market regime.”
At the time of writing, Bitcoin is trading around $24,500, up 13% in the last seven days.
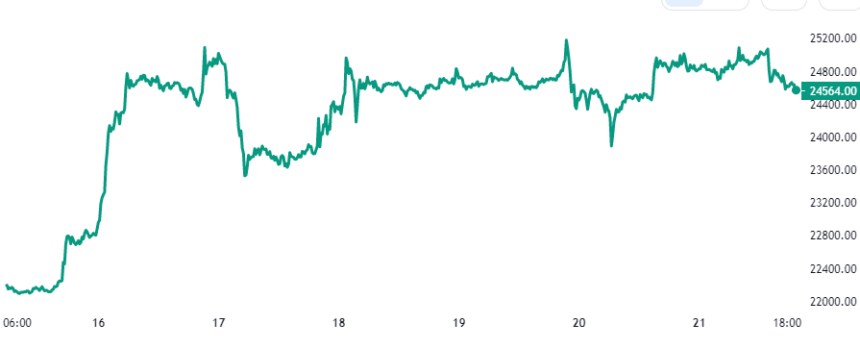
BTC consolidates sideways | Source: BTCUSD on TradingView