
Dilution-proof, June 1, 2021
Cycling On-Chain is a monthly series that uses on-chain and price-related data to estimate where we are in bitcoin’s market cycle. It originally started as a monthly Twitter thread that was later adopted by Bitcoin Magazine. In this first edition of Cycling On-Chain, we’ll look back at the first leg up in the 2020–2021 bull run and the circumstances that turned out to be fertile soil for a firm downward correction that brought fear into the market. The second part will attempt to look forward by building a case for why we may not have seen the top of this market cycle, as well as some of its vulnerabilities.
The January Turnaround
Just like the previous two versions, 2020’s halving created a supply shock that triggered an exponential price increase. However, in comparison to the previous (2016) halving cycle, this cycle heated up much faster (figure 1).
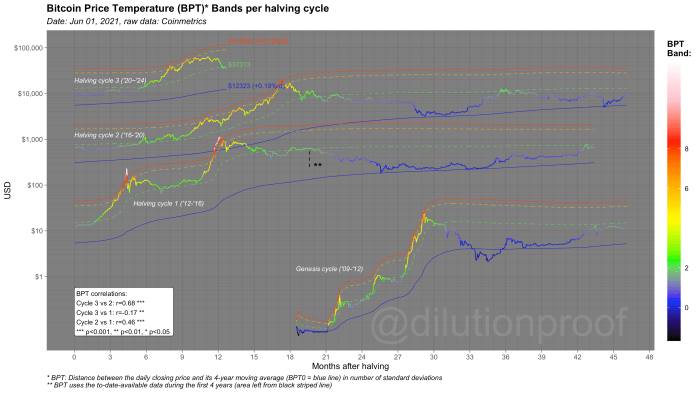
Figure 1: The Bitcoin Price Temperature Bands per halving cycle
As you would expect during such a rapid price increase, market participants started taking profits when the bitcoin price broke its all-time high in December 2020 and the period after (figure 2). Since forming a local market top in January 2021, profit taking decreased — despite the price still grinding up further during that period.
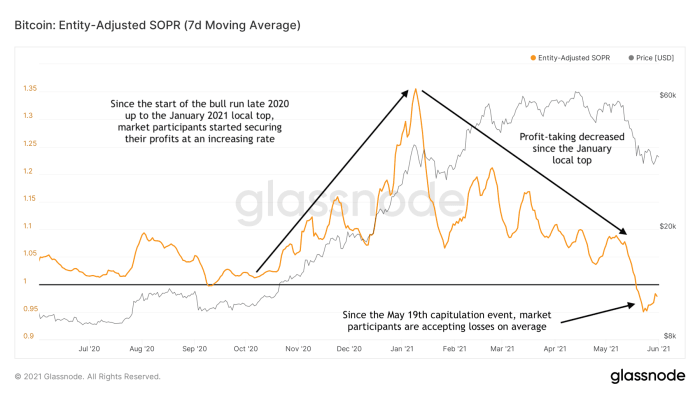
Figure 2: A seven-day moving average of the Entity-Adjusted Spent Output Profit Ratio (SOPR)
What usually happens during these exponential price increases (figure 3), is that long-term bitcoin holders (green) start to gradually sell, while new market participants (purple) start building their positions — until the market cycle reaches a top and both parties switch roles.
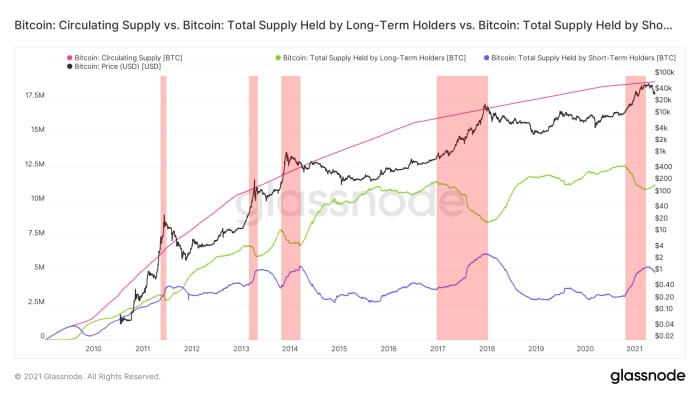
Figure 3: The bitcoin price (black) and the total (blue), long-term holder (green) and short-term holder supply (pink)
If we zoom in on the net position change of the long-term bitcoin holders (figure 4), we see that long-term holders were mostly selling up to the January 2021 local top, slowed down their spending afterward and have turned into net accumulators during this price dip.
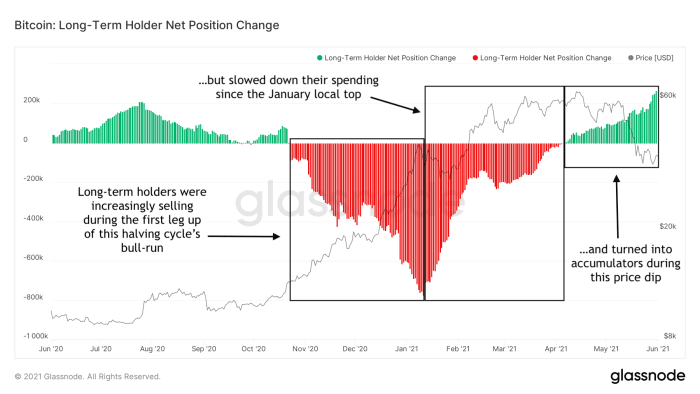
Figure 4: Bitcoin price (black) and long-term holder supply change (green and red)
A similar trend can be witnessed in the net position change of miners (figure 5), another class of market participants with clear long-term market experience and exposure.
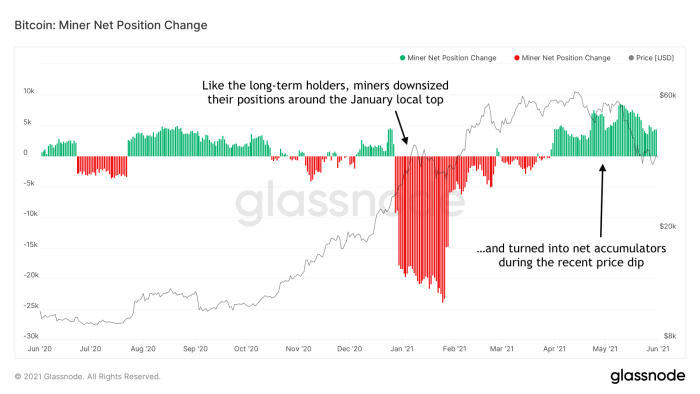
Figure 5: Bitcoin price (black) and miner net position change (green and red)
Levering It Up
In March 2020, a large macro-driven price crash cleared the bitcoin market from all leverage and created more organic market conditions that turned out to lay the groundwork for this 2020–2021 bull run. Since then, a clear trend of decreasing bitcoin reserves on exchanges was witnessed, suggesting that a large supply shock was forming. After the bitcoin price broke its 2017 all-time high, this trend has accelerated on pure spot exchanges that don’t offer derivatives trading (figure 6).
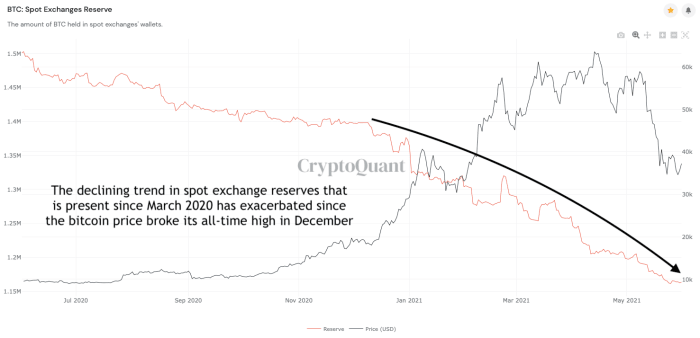
Figure 6: Bitcoin reserves on spot exchanges
However, the opposite is true when looking at exchanges that do offer derivatives products (figure 7). These derivatives exchanges have seen their bitcoin reserves increase, especially after the price started consolidating and correcting.
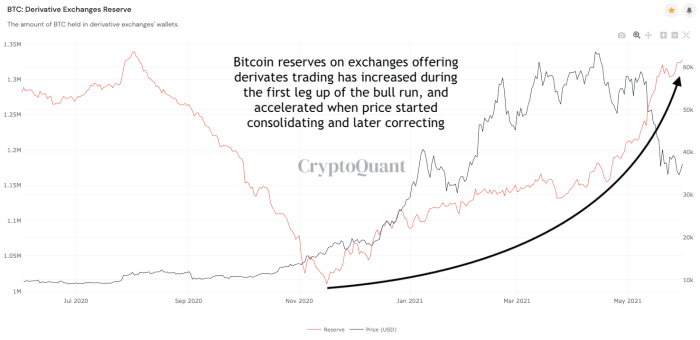
Figure 7: Bitcoin balances on derivative exchanges
The bitcoin reserves on derivatives exchanges are (at least partially) held as collateral for (high) leveraged trading. In the months following the January 2021 local top, the amount of open interest on bitcoin futures more than doubled (figure 8), suggesting that market participants were increasingly comfortable taking risks — a possible sign of market euphoria.
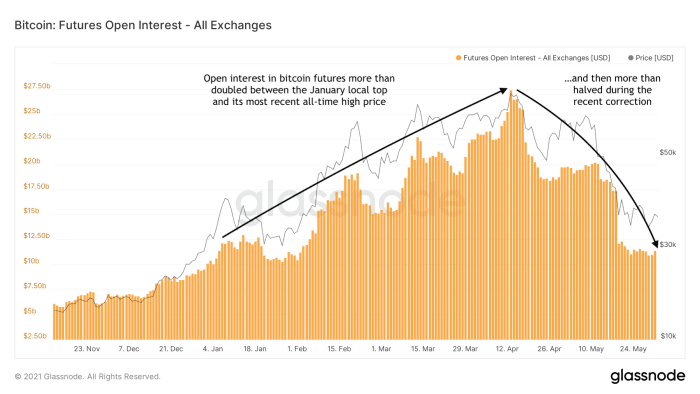
Figure 8: Open interest in bitcoin futures on all exchanges (Source)
As can be seen in figure 9, most of this open interest was representing long positions. When the market is massively (over)leveraged into one direction, there is a clear incentive for large market participants to push the price the other way. When the bitcoin price drops below a long position’s liquidation price, exchanges can force-sell the position, creating even more downward price pressure, potentially forming a cascading effect of long liquidations that is combined with a steep price decline, which is exactly what we saw on May 19, 2021.
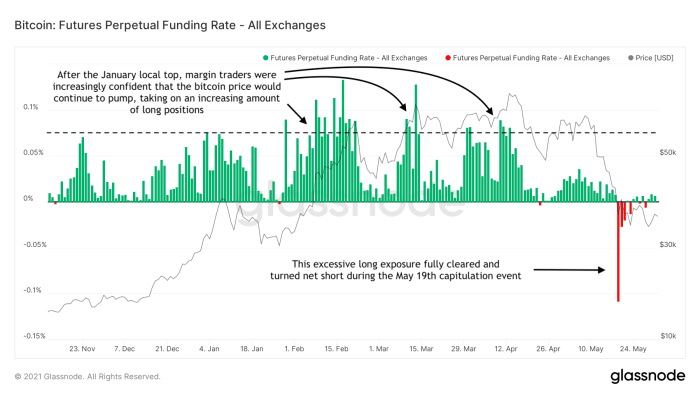
Figure 9: Funding rate of perpetual bitcoin futures on all exchanges
A Change Of Scenery
A change of scenery could be witnessed in several other metrics during the first quarter of 2021. For instance, the bitcoin holdings of the Grayscale Bitcoin Trust that had seen steep increases based on institutional demand stopped rising in February 2021 (figure 10), while the premium on its (GBTC) shares actually turned deeply negative.
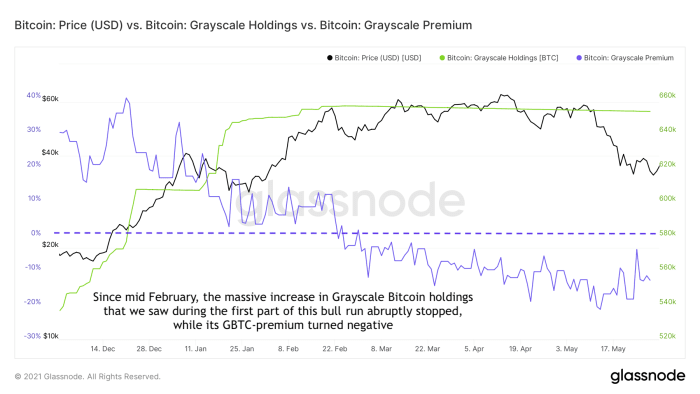
Figure 10: The bitcoin price (black) and Grayscale's holdings (green) and premium over spot-market price (purple)
During the first quarter of 2021, the anticipation of Coinbase’s direct listing (sometimes referred to as their initial public offering or IPO) was another narrative that a lot of market participants were following. Both the bitcoin price (orange) and COIN price (black and white) were creeping up during the months up to this event, and found their all-time highs around their direct listing date on April 14, 2021 (figure 11). The direct listing was accompanied with large sell pressure from COINBASE executives that were selling part of their positions, creating a steep downward price movement in the price of their shares.
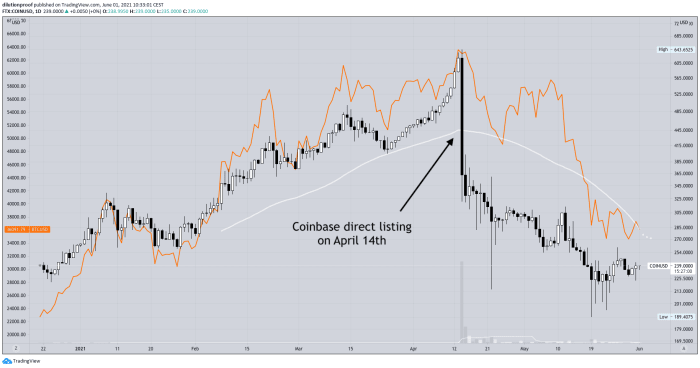
Figure 11: USD price charts for Coinbase (COIN, black and white) and bitcoin (BTC, orange)
Another clear trend change that occurred after the January 2021 local top was the fast decline in bitcoin dominance that we have seen since then (figure 12). This declining bitcoin dominance means that altcoin price appreciation was outperforming that of bitcoin, which can likely be attributed to retail market participants entering the scene en masse.
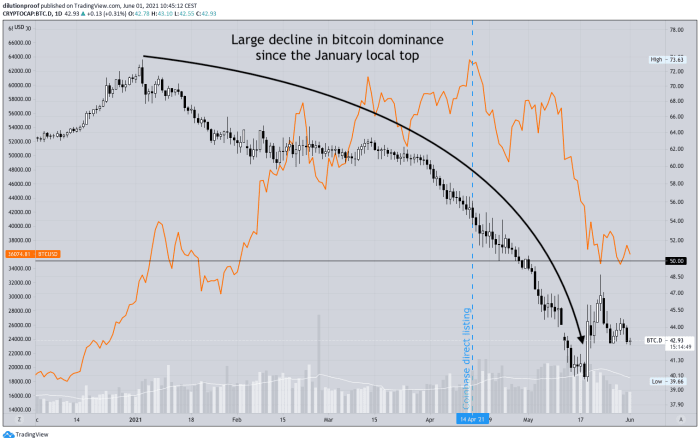
Figure 12: Bitcoin dominance (black and white) and price (Orange)
Young Whales Crashing The Party
Since the January 2021 local top, a clear downward trend can be witnessed in the degree in which older coins are responsible for the on-chain volume (figure 13). This means that recent price movements can increasingly be attributed to relatively young market participants.
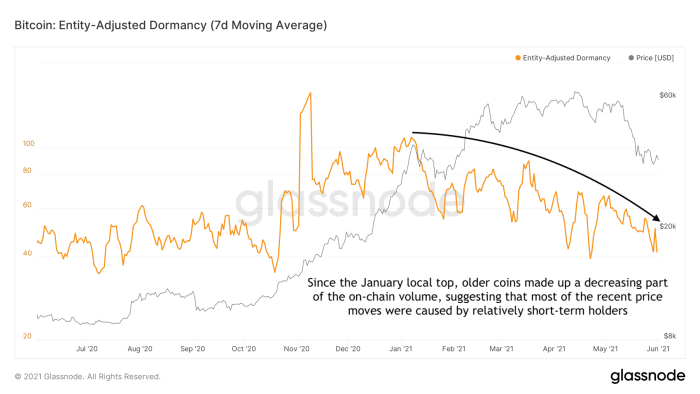
Figure 13: A seven-day moving average of the entity-adjusted bitcoin dormancy
When zooming in on the on-chain movements of the largest players in the bitcoin market (“whales”), it is also clear that most of the on-chain movements were made by young whales. An example of this is visualized in figure 14, where the green circles highlight the (magnitude of) whale addresses that transacted on-chain during the May 19, 2021, capitulation event. These on-chain movements are likely a combination of these young whales (1) triggering the price crash itself, (2) selling out of anxiety, (3) getting liquidated from their long positions and (4) buying back at a lower price for tax benefits (“tax harvesting”).
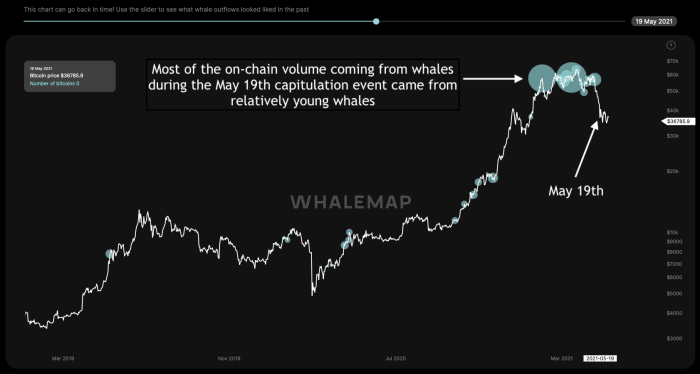
Figure 14: Outflows from whale wallets on May 19, 2021
A Mountain Without A Peak
The big question that remains — is this party over now...?
It is impossible to predict the future based on historical data since the context of that data continuously changes and future events can simply take a different course. Nonetheless, comparing current and historical on-chain data structures can be helpful to gauge to what extent (cyclical) investor behavior rhymes in terms of market psychology.
One example of this is illustrated in figure 15. Unlike the previous market cycles, whose tops were all marked by an exponential blow-off top that was combined with long-term holders massively selling into market strength, this cycle (so far) has had neither. Of course, this cycle does not have to be similar to the previous ones, but this does illustrate that it would be quite atypical if the current cycle indeed ends with a dud.
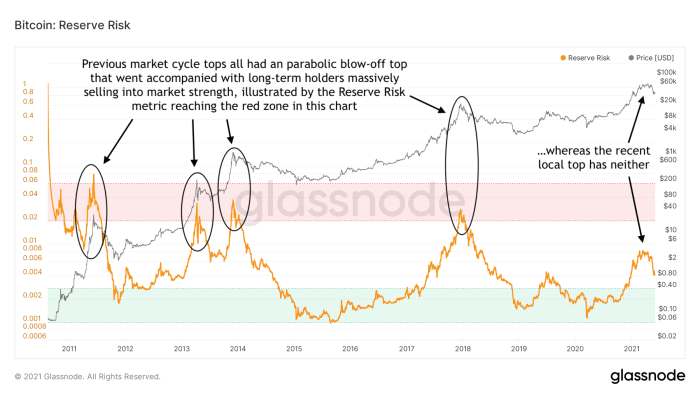
Figure 15: The Reserve Risk indicator
A New Hope(?)
As just pointed out, we cannot predict the future based on on-chain data; but we can monitor trends in its flows to help us understand recent market movements and more substantially speculate where the market might move next. Despite the steep price drop, some positive on-chain signals could be witnessed.
During the recent market correction, exchanges saw large net inflows of the short-term holders that were getting out of their positions (figure 16). As price declined, so did the net transfer volume from/to exchanges, even turning net negative again near the end of the price dip. This suggests that the lower prices triggered (new?) demand, increasing confidence that buyers will continue to step in during dips.
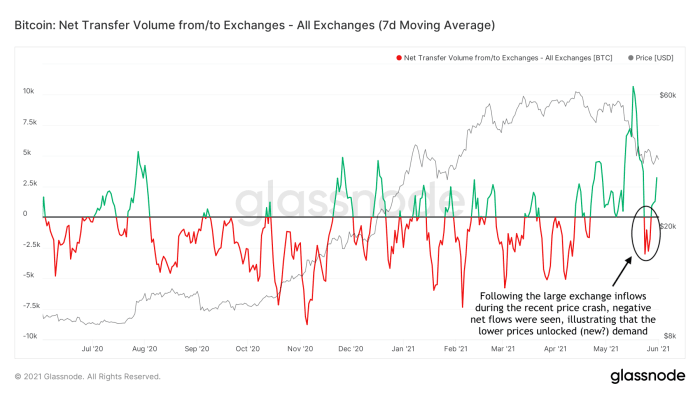
Figure 16: A seven-day moving average of the net transfer volume of bitcoin from/to exchanges
During this dip, there also were large outflows in over-the-counter (OTC) trade desks (figure 17). These OTC desks facilitate trading between larger entities that want to buy or sell bitcoin without moving markets.
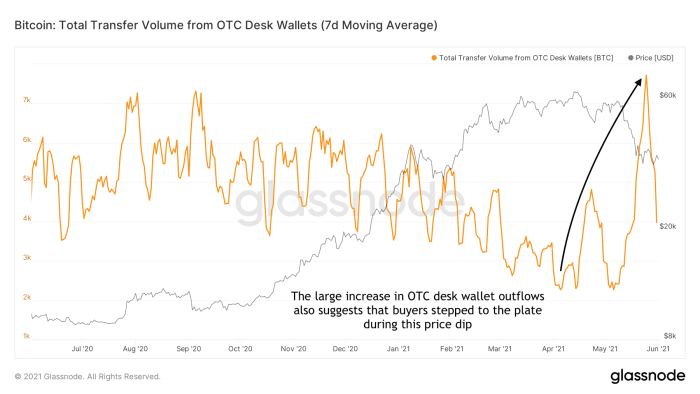
Figure 17: A seven-day moving average of bitcoin outflows of OTC trade desks
Another possible sign of continued demand for (spot) exposure to bitcoin is the stablecoin reserves on spot exchanges that have continued to go up (figure 18).
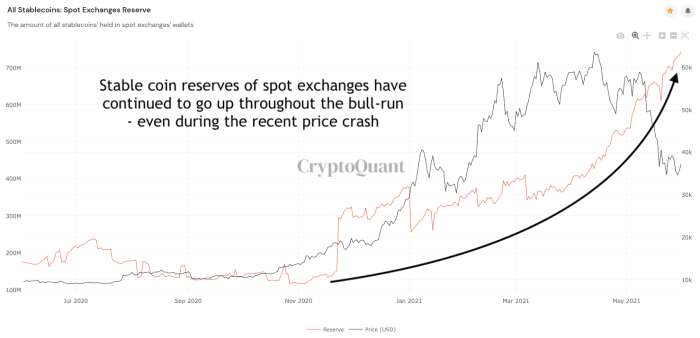
Figure 18: Stablecoin reserves on spot exchanges
Based on the number of accumulation addresses recently peaking to new all-time highs, the price dip also appears to have triggered market participants to dollar-cost average (DCA) into a bitcoin position (figure 19).
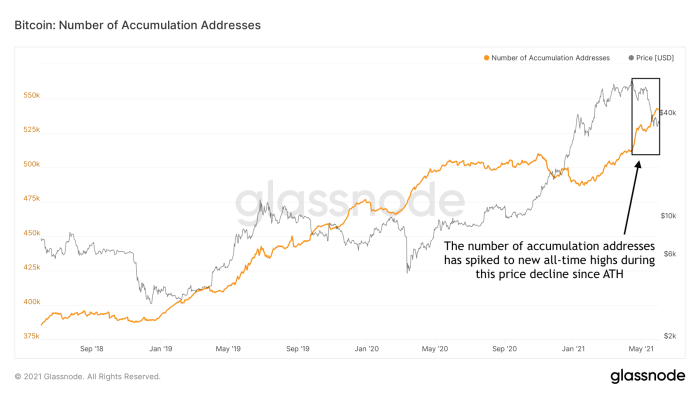
Figure 19: Number of bitcoin accumulation addresses
Finally, the recent spike in the net growth of entities on the Bitcoin network suggests that during the price crash more entities joined than left, also suggesting that the lower prices enticed some people to buy into a position (figure 20).
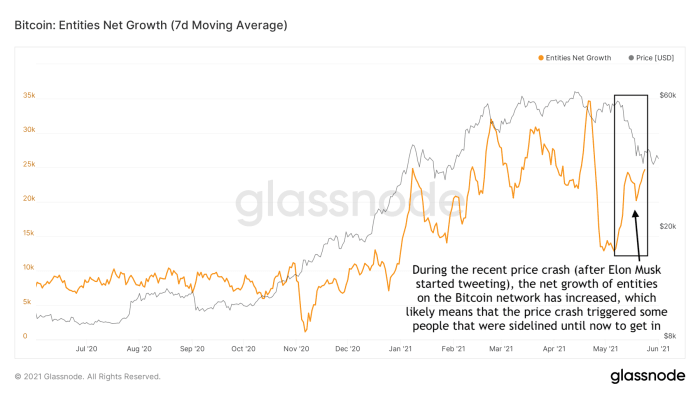
Figure 20: A seven-day moving average of the net growth of entities on the Bitcoin network
Although Twitter polls always need to be taken with a grain of salt, the results of the poll displayed in figure 21 provide another signal that market participants still have a positive mid- to long-term expectation for the bitcoin price. Respondents are neutral to mildly bullish on a weekly to monthly time frame but clearly still very bullish on a yearly time frame.
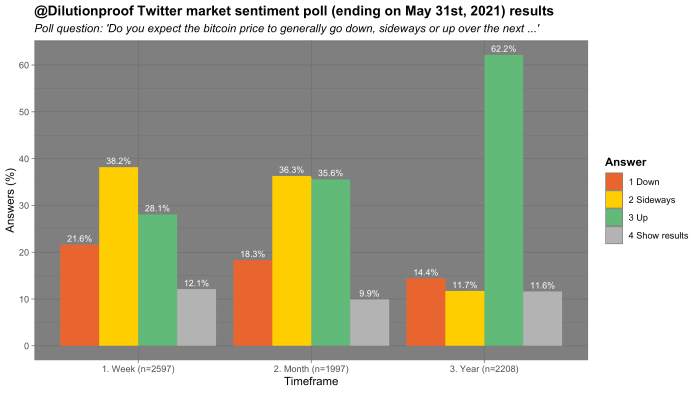
Figure 21: Bitcoin market sentiment based on a May 31, 2021, Twitter poll
Taproot
Besides price-related interest in bitcoin’s prospects, prospects about Bitcoin’s Taproot protocol upgrade may provide a more fundamental driver for enthusiasm throughout the remainder of 2021. Taproot improves some of Bitcoin’s on-chain privacy characteristics and unlocks new possibilities for scaling, smart contracts and Lightning. The protocol upgrade is expected to be locked into activation within the next two weeks and will be activated in November 2021 if successful.
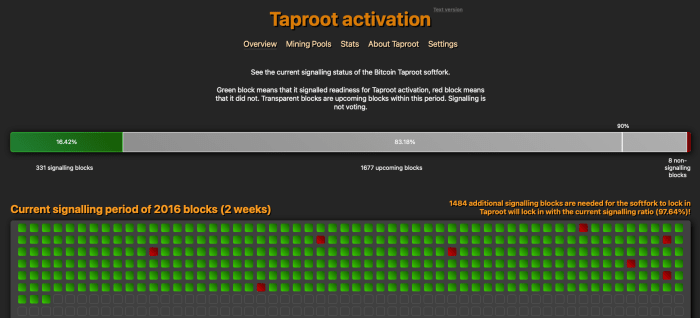
Figure 22: The status of the miner signaling process for the Taproot Bitcoin protocol update on June 1, 2021
A Note Of Caution
The recent unwinding of leverage and change of scenery provided a call for caution, as well as a warning that the bitcoin market has reached a very volatile and vulnerable phase, regardless of the direction in which it moves next.
During the past year, bitcoin has matured into a macro-asset that is increasingly adopted by institutional investors, moving the asset into a whole new playing field. It may, therefore, see regulatory headwinds that can spur anxiety into markets, even if those narratives are based on flawed information.
Another possible result of the increased institutional adoption is that its price developments may increasingly start following those of the larger overall macro cycle. Like we saw in March 2020, its price course may be impacted if a macro-economic breakdown were to happen.
A Possible Outlook For 2021
There are no guarantees that the bitcoin price will necessarily mimic the trajectories of its previous (halving) cycles. Nonetheless, models like the S2F and S2FX, time-based models or more simple previous cycle indexes that are displayed in figure 23 may be useful for getting a rough idea of what may be ahead if bitcoin’s four-year cycle indeed rhymes at least one more time.
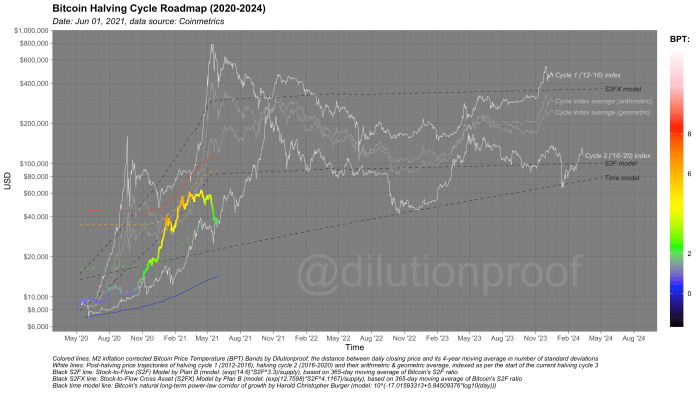
Figure 23: Bitcoin halving cycle roadmap (2020–2024)
Disclaimer: This article was written for educational, informational and entertainment purposes only and should not be taken as investment advice.
This is a guest post by Dilution-proof. Opinions expressed are entirely their own and do not necessarily reflect those of BTC, Inc. or Bitcoin Magazine.
